Network Operations Study Guide for the CompTIA Network+
Page 1
General Information
When a network has been planned and implemented, there are important concepts to know about its daily operations. The questions about network operations on the CompTIA Network+ exam occupy about 16% of the test, and about one-third of them begin with a scenario. Be sure you can apply what you know about operation procedures.
Using Statistics and Sensors
Once a network has been established, the priority is keeping the network performing its duties in the most seamless and uninterrupted way possible. A large component of this network monitoring process involves using various sensors and performance statistics to evaluate the health of the network. You should be able to identify, implement, and evaluate the appropriate sensors and statistics to use given a specific scenario.
Performance Metrics/Sensors
The performance of a network and the devices in the network is evaluated using specific metrics. These metrics are collected from devices through different types of monitoring sensors.
Device/Chassis
A hardware network device, such as a router or switch, is housed in a chassis. The chassis is the physical component that contains and protects the internal components of the device. These networking devices use common metrics to gauge performance.
Temperature
Computing devices generate heat, sometimes an extensive amount. This excess heat can damage the internal components of a device or reduce the device’s efficacy. Therefore, both the internal and external temperatures are metrics used to identify if the device or its surroundings are within optimal range.
Central Processing Unit (CPU) Usage
While the optimal parameters of CPU usage vary between devices, there are common usage metrics, or counters, to use when monitoring CPU usage. The percent of processor usage time for an active thread should typically be sustained below 85%.
A processor that spends more time in user mode (when a processor is working on an application) than baseline operations may indicate a system or application that is dominating CPU processing power. A CPU that exceeds 15% interrupt time (when the CPU gets and responds to hardware issues) could indicate a hardware problem. Finally, a processor queue of double the amount of CPUs (or more) could indicate a processor that is not able to keep up with the workload.
Memory
Memory parameters, like CPU usage, vary from device to device but do have common counters to monitor for performance, including percent of working memory in use and the percent of storage memory available. If the former is over 80% or the latter is under 5%, that could indicate a need for additional memory. Also, the amount of space available for entries on the page table (less than 5,000), the amount of paged pool (over 250 MB) and non-paged pool (over 175 MB) space available, and the page rate (over 1,000 pages/sec) could indicate a memory leak.
Network Metrics
Network metrics are used to evaluate the performance and health of a network, including how well data flows within the network.
Bandwidth
Bandwidth usage, which identifies how much of the available frequencies are in use, also has common metrics that can be used to indicate performance health. A network interface controller (NIC) is capable of processing a specific amount of bandwidth. A usage exceeding 70% may indicate a saturated NIC. Also, if the NIC has an output queue value over 2, it may be incapable of handling the workload.
Latency
Latency is a metric used to identify the amount of time delay that occurs during network data processing. The lower the latency, the less delay a network usually experiences. Latency is typically measured using round-trip time (RTT), which pings a server and measures how long it takes for the response to get back to the sending device. Security protocols and processes are a common cause of increased latency.
Jitter
Jitter is not a typically measurable metric but rather refers to the inconsistent flow of data through a network. Jitter is most often observed in real-time communications, such as video calls. Jitter can be a result of network congestion, routing changes, and time drift.
Simple Network Management Protocol (SNMP)
SNMP is a network monitoring tool that collects data via ports 161 and 162 to use in network performance analysis. SNMP sends signals out to network devices at predetermined or random intervals requesting information. This data is analyzed, and a performance baseline is identified and stored in a management information base (MIB), which is then used to identify anomalies in the network. There are three versions of SNMP: SNMPv1, SNMPv2c, and SNMPv3. Each subsequent version provides higher functionality and security.
Traps
An SNMP trap is an unsolicited message that is sent from an end device to the SNMP network management station (NMS) when an aberration is identified. The trap is triggered based on preset events or conditions.
Object Identifier (OID)
An OID is a standardized naming identifier for objects, concepts, or parts with globally consistent persistent names. In SNMP, the OID is used to identify unique network devices and their statuses.
Management Information Base (MIB)
An MIB stores OID information based on a hierarchical structure:
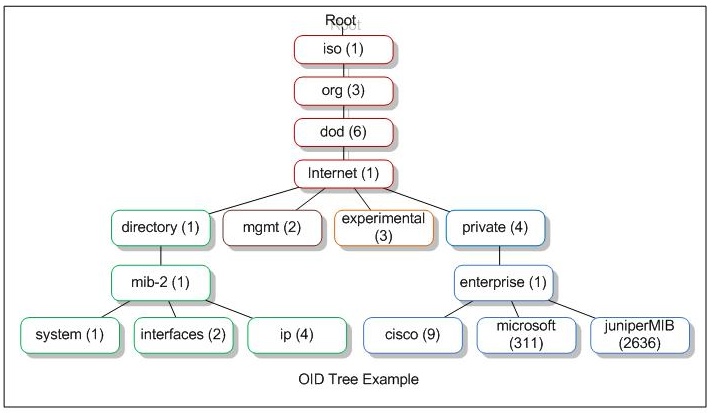
Retrieved from: https://mn.m.wikipedia.org/wiki/%D0%A4%D0%B0%D0%B9%D0%BB:SNMP_OID_MIB_Tree.png under this license: http://creativecommons.org/licenses/by-sa/3.0/.
Network Device Logs
Network devices are preprogrammed to record certain types of data in various logs. These logs can be used to evaluate the health of a networking device. Logs may also be configured with limited space size, filled log behavior, and log saving for viewing later. You should be familiar with common log types and the information that they contain.
Log Reviews
Log reviews begin with an established baseline of a healthy network. When creating a baseline for logs, make sure the network conforms to all regulations, internal and external, as well as the appropriate security practices required for the network.
Traffic Logs
A traffic log records network traffic that has passed through the device. Firewalls, intrusion detection systems (IDS), and intrusion prevention systems (IPS) commonly employ the use of traffic logs, which can be sent to a separate syslog server or a Security Information and Event Management (SIEM) system.
Audit Logs
An audit log is a general term for logs used to record user activities. Audit logs, depending on the device, are also referred to as history logs, events logs, general logs, or server logs. On a Windows OS, the audit log system is called Event Viewer. The primary audit logs of the event viewer include application logs, security logs, and system logs.
Syslog
A syslog, or syslog server, is a server that collects messages sent from connected network devices, such as routers and switches. The syslog server can also be configured to timestamp and sequence messages to provide a simplified method of sorting, searching, and displaying messages. Syslog messages are typically formatted in the following order: sequence number, timestamp, facility, severity, mnemonic (text identifier describing the message), and description (detailed event information).
Logging Levels/Severity Levels
A logging level, also known as a severity level, is a method of categorizing the severity of a syslog message or a log alert from a log management system, with the scale going from 0 to 7. This is what each severity level means:
| Severity Number | Severity Level | Description |
|---|---|---|
| 0 | emergency | system down |
| 1 | alert | immediate action necessary |
| 2 | critical | condition critical |
| 3 | error | condition error |
| 4 | warning | condition warning |
| 5 | notice | condition normal but may require monitoring |
| 6 | informational | information about normal operations |
| 7 | debug | information for debugging purposes |
Interface Statistics/Status
The interface is the portion of a device or system that the user interacts with to execute commands and complete other functions. The interface, like other components of a device or system, collects data and metrics for analysis and evaluation.
Link State (Up/Down)
The link state of an interface indicates if the interface is either up (functional or down (nonfunctional). Some link state indicators can also provide information as to the cause of the issue. For example, if an Ethernet-linked interface is queried, it will show two link states, with the first being the carrier link and the second being the remote link.
Speed/Duplex
The speed and duplex properties of an interface can also be monitored and checked for proper configuration. For communications between network devices, the speed and duplex of the communicating devices must be configured the same.
Send/Receive Traffic
Send and receive interface traffic refers to the data flowing in and out of an interface. On a Windows interface, input-output statistics can be checked using the netsh command. If there is no traffic identified, the interface is down.
Cyclic Redundancy Check (CRC)
A CRC is an error detection tool used to identify data that has been corrupted in some manner by assigning a checksum value to blocks of data and comparing the original checksum value to the current value. An excessive number of CRC errors may indicate an issue in the network or interface.
Protocol Packet and Byte Counts
Protocol packet and byte counts are statistics that measure the number of packets and bytes transmitted through an interface by a protocol. Protocol packet and byte counts can be used to assess the health and functioning of a specific protocol.
Interface Errors or Alerts
When an interface experiences an issue, an error or alert message may appear. Errors and alerts can also be detected using the previous interface statistics and monitoring statuses. You should be familiar with common errors and alerts regarding interfaces.
CRC Errors
A CRC error indicates damaged packets. While CRC errors are most commonly caused by a Layer 1 issue, such as a bad physical cable or connection point, they may also be caused by a Layer 2 problem, such as collisions or duplex compatibility.
Giants
A giant is a packet that exceeds the maximum packet size of the transmission as well as an incorrect frame check sequence (FCS). A giant is commonly the result of a collision or a faulty NIC and will be dropped.
Runts
A runt is a packet that does not meet the minimum packet size requirements of the transmission, and it is also commonly caused by collisions or faulty NICs. Runts will be dropped.
Encapsulation Errors
Encapsulation is the process of adding headers and trailers to data packets at each Open Systems Interconnection (OSI) layer. Encapsulation errors occur when a Layer 3 device attempts to route data but encounters some type of problem with the Layer 2 header.
Environmental Factors and Sensors
For a network to function optimally, the environment in which the hardware devices are located needs to be monitored for different environmental factors that can harm or affect networking devices. Environmental sensors are used to monitor location conditions and provide alerts to potential environmental issues. Since best practice recommendations periodically change, refer to the latest available recommendations for the networking environment.
Temperature
Computing devices, including networking devices such as switches and routers, generate heat. Networking devices should be kept in a cool setting with an appropriate amount of ventilation for optimal performance. Excessively high temperatures can cause devices to malfunction, such as random server reboots, while low temperatures can also cause device malfunction, such as slowed response time.
Humidity
Humidity is the amount of moisture that is contained in the air. Like temperature, there is a recommended humidity level for optimal network performance. Air that is too dry or too damp can result in network malfunction. For example, excessively dry air can cause a buildup of static electrical charges, and excessively damp air can cause corrosion.
Electrical
Networking devices consume a large amount of electrical power. For optimal network performance, networking devices should have access to a constant and controlled power supply. Circuit breakers can be used to provide protection against power surges, an uninterruptible power supply (UPS) can be used to provide temporary power to networking devices, and generators can be used to provide longer-term electrical power in case of a power outage.
Flooding
Networking devices are highly susceptible to water damage, such as flooding. One method of flood prevention in networking environments is to place devices in an elevated position off of the ground level. For example, in a multistory building, networking devices could be located on the second floor, while in a single-story building, a raised floor can be used to reduce the risk of flood damage.
Baselines
A baseline is a standard performance level of a device or network. Baselines can be established through analysis of standard network operations, such as CPU usage, network traffic flow, and bandwidth usage. Baselines are used to identify abnormalities in the network or network devices.
NetFlow Data
NetFlow is a Cisco proprietary application that is used to collect data on Transmission Control Protocol/Internet Protocol (TCP/IP) traffic flowing through a network. The NetFlow application is an extensive tool that can be used for multiple purposes, including measuring network service usage, accounting for resource utilization, and network planning for resource deployment and optimization for end users. Common information collected by NetFlow includes the source and destination IP addresses, source and destination port numbers, network layer protocol, type of service (ToS), and logical input interface.
Uptime/Downtime
Uptime and downtime are measurements of network availability to end users, with uptime referring to the percentage of time a network is accessible and functioning and downtime being the amount of time it is inaccessible. Uptime percentages use the “-nine” terminology to identify how reliable a network is. For example, if a network has five-nine uptime, it is available 99.999% of the time.
All Study Guides for the CompTIA Network+ are now available as downloadable PDFs