Math Study Guide for the PSAT/NMSQT Exam
Page 2
Equations
An equation is made of expressions and includes an equal sign somewhere within it.
Linear Equation
A linear equation is an equation that results in a straight line when graphed. Linear equations contain two important pieces of information: the slope, and the \(y\)-intercept.
The slope of a line is the ratio of the change in the \(y\)-values to the change in the \(x\)-values; a convenient way to remember this is the expression, rise over run, where the rise is how far the line climbs and the run is how far it extends horizontally. The \(\bf{y}\)-intercept is where the line crosses the \(y\)-axis.
Linear equations are commonly expressed in a few ways: slope-intercept form, point-slope form, and standard form.
Slope-intercept form: \(y=mx+b\), where \(m\) is the slope, and \(b\) is the \(y\)-intercept. As the name indicates, this form is useful when the slope and the \(y\)-intercept are known.
Point-slope form: \((y-y_1) = m(x-x_1)\), where \((x_1, y_1)\) is a point on the line, and \(m\) is the slope. As the name indicates, this is a useful form when the slope of a line and a point on the line are both known.
Standard form: \(ax+by=c\) where \(a\), \(b\), and \(c\) are constants. This form is useful for quickly finding the \(x-\) and \(y-\)intercepts.
Nonlinear Equation
A nonlinear equation contains two variables, with one of the variables having an exponent other than \(1\). Quadratic equations, exponential equations, inverse equations, and logarithmic equations are all nonlinear equations.
Some common forms of these equations:
Quadratic equation: \(ax^2 + bx + c = d\)
Exponential equation: \(f(x) = 0.45^{x+2}\)
Inverse equation: \(f(x)=\frac{1}{x}\)
Developing a familiarity with all of the common nonlinear equation forms is critical for success in mathematics.
Systems of Equations
A system of equations is the grouping of \(\bf{2}\), \(\bf{3}\), or more equations together. Systems of equations can be solved just as equations can; however, in order for a system of equations to have a solution, there must be as many equations as there are variables.
A system of equations that has one solution indicates that the equations intersect exactly once. A system of equations that has infinite solutions indicates that the equations are the same. A system of equations that has no solution indicates that the equations do not intersect.
Systems of equations can be solved graphically and algebraically (via combination/elimination or substitution).
Consider the following system of equations:
\(-2x+y=1\)
\(x+y=4\)
Solving by substitution entails solving one of the equations for a variable in terms of the other variable and substituting the solved expression into the other equation to calculate the value of one of the variables. This solved value is then substituted into either equation to solve for the other variable.
Solving by elimination entails multiplying one of the equations (if necessary) by a multiple that eliminates one of the variables when the two equations are combined through addition.
Solving by graphing entails graphing each equation and locating the point of intersection (if the lines intersect).
Utilize each method to verify that the solution to the example above is \((1,3)\).
A solution can be further verified by plugging both values of the solution into the original equations and noting that the equations yield a true statement:
\(-2(1)+(3)=1\), for example.
Equalities and Inequalities
An equality indicates that the two terms or expressions on either side of the equal sign are equal to the same value:
\(x=3\), \(x+2=9\), and \(x-2=2y\) are all equalities.
An inequality indicates that one of the terms is greater than, less than, greater than or equal to, or less than or equal to the term on the other side.
Equalities and inequalities are both solved using the same method. A variable is isolated by combining like terms and then undoing the operations performed on the variable. For example:
\[-3x + 2 > 14\]Begin by subtracting \(2\) from both sides and then dividing both sides by \(-3\):
\[x < -4\]Notice that when dividing (or multiplying) by a negative value, the direction of the inequality switches. The graph of this solution would be an open circle at \(x = -4\) with an arrow pointing to the left. Open circles or dotted lines are used to graph greater than or less than inequalities; closed circles or bold lines are used to graph greater than or less than equalities.
It is important to understand that an open circle indicates that the number (in this case \(-4\)) is not included as part of the solution set. A closed circle or line indicates that the value at the circle, or the values along the line, are part of the solution set.
Greater than or equal to solution sets are shown by shading the values to the right of, or above the solution. Less than or equal to solution sets are shown by shading the values to the left of the solution.
Geometrical Studies
Geometry involves the study of both two-dimensional and three-dimensional figures.
Lines
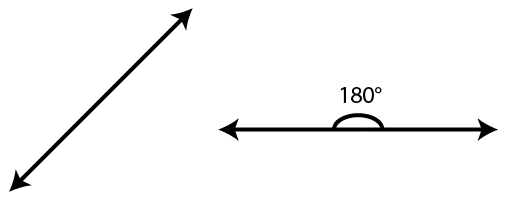
A line is a straight, one-dimensional figure that extends to infinity in both directions. Lines measure \(180^\circ\).
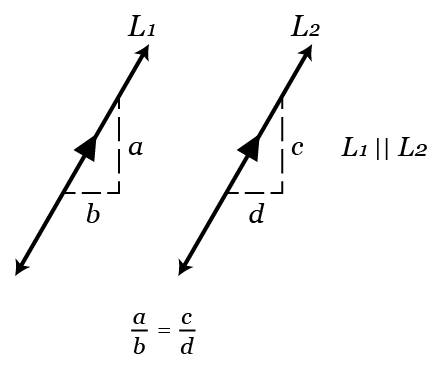
Two lines are parallel if they share the same slope. Parallel lines do not intersect.
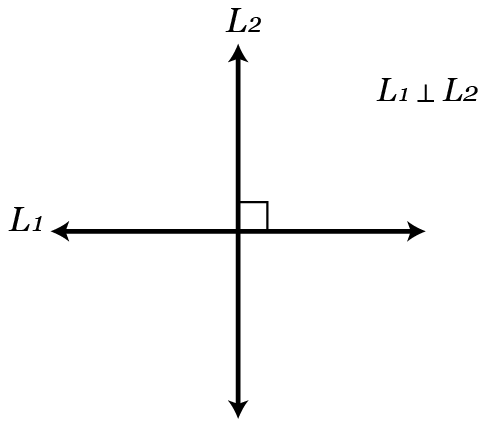
Two lines are perpendicular if their slopes are negative reciprocals of each other. Perpendicular lines form \(90^\circ\) angles with each other.
Angles
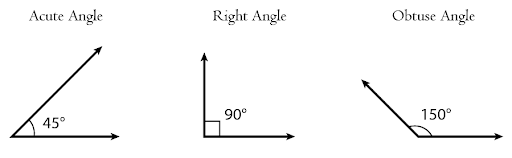
Two distinct rays that start from a single point form an angle. Angles can be acute, right, or obtuse. Acute angles measure between \(0^\circ\) and \(90^\circ\) $, right angles measure \(90^\circ\), and obtuse angles are larger than \(90^\circ\).
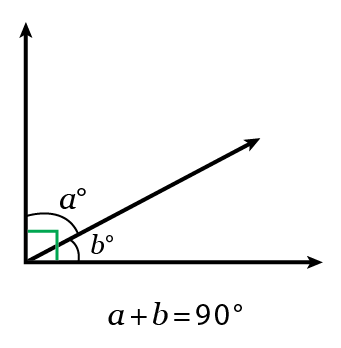
Complementary angles are two angles that, when added together, sum to \(90^\circ\).
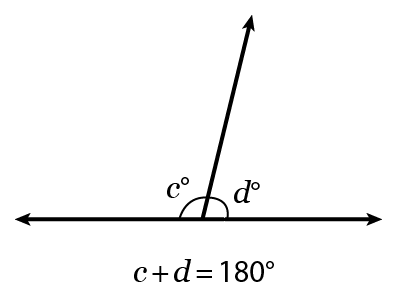
Supplementary angles are two angles that, when added together, sum to \(180^\circ\).
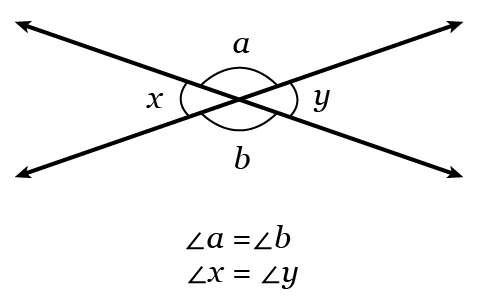
Vertical angles are congruent; they are formed at the intersection of two lines.
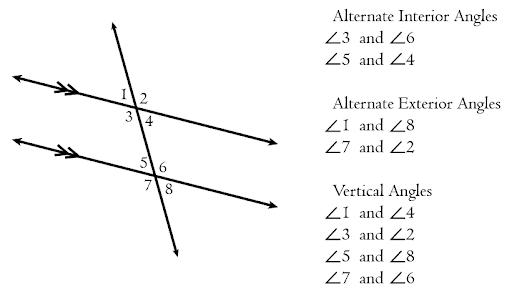
When a line intersects two parallel lines, it creates a set of alternate interior angles (which are congruent), alternate exterior angles (which are congruent), and vertical angles (which are congruent). Interior angles form a linear pair, and exterior angles also form a linear pair.
Triangles
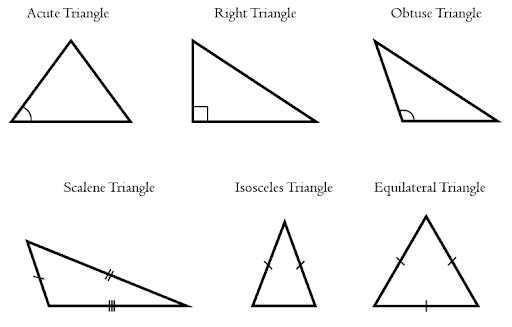
Triangles are three-sided figures. The interior angles of a triangle sum to \(180^\circ\). There are acute, right, and obtuse triangles. There are also scalene, isosceles, and equilateral triangles.
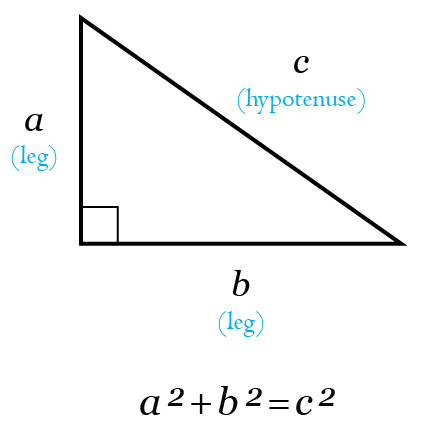
Right triangles are of particular interest because of the relationship between the side lengths. The Pythagorean theorem states that \(a^2+b^2=c^2\), where a and b are the legs or shorter side lengths of a right triangle, and c is the longest side or hypotenuse. It is crucial that this theorem and its implications are fully grasped.
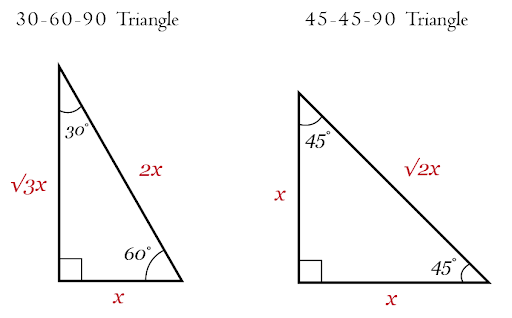
Two special right triangles are the \(30^\circ, 60^\circ, 90^\circ\) triangle and the \(45^\circ, 45^\circ, 90^\circ\) triangle. These right triangles display side lengths in the ratios of \(x,\; x\sqrt{3}, \;2x\) and \(x,\;x,\; x\sqrt{2}\), respectively.
Circles
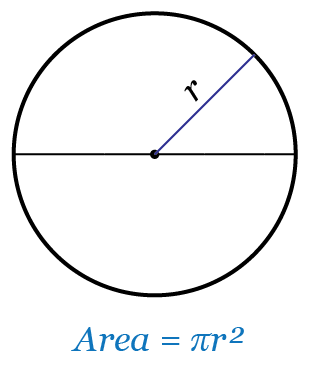
Circles are figures that possess a center, and a sequence of points that are equidistant from this center. The distance from one edge of the circle to the other edge through the center of the circle is known as the diameter. Half of the diameter, or the distance from the center to any point on the circle, is called the radius.
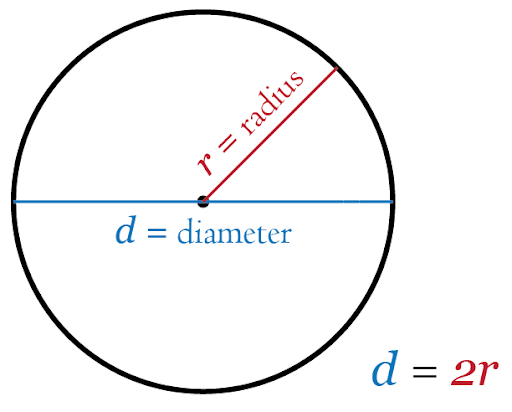
Circles are \(360^\circ\). The area of a circle is \(\pi r^2\), and its circumference is \(2\pi r\).
Perimeter and Circumference
The perimeter of a figure is the total distance around the figure or the sum of all side lengths. Perimeter is one-dimensional and has unit lengths that reflect this. Calculate the perimeter of figures with straight lines by summing the side lengths.
The perimeter of a circle is called the circumference. The circumference of a circle is equal to twice the radius times pi:
\(C = 2\pi r\).
Area
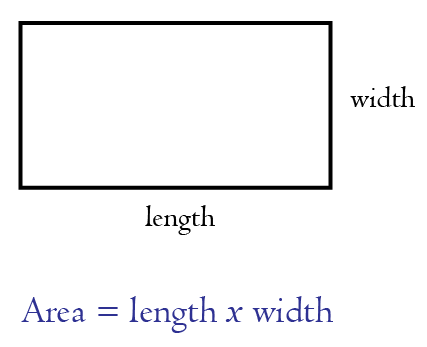
Area is a two-dimensional quantity that measures the amount of space inside the perimeter of a figure. For example, a square of side length \(10\) meters has an area of \(100 \;m^2\) because the length of the two sides of the shape are both \(10\) meters, and \(10 \cdot 10 = 100\). Area is described in squared units.
It is helpful to memorize some of the common area formulas and practice using them.
Quadrilateral: \(\text{length } \cdot \text{ width}\)
Circle: \(\pi \cdot r^2\) (where r is the radius of the circle)
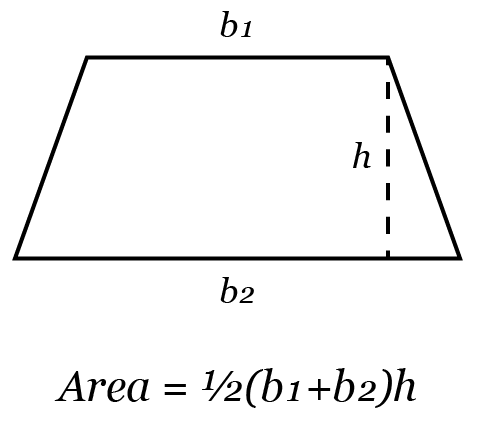
Trapezoid: \(\frac{1}{2}\cdot(b_1+b_2)\cdot h\) (where \(b_1\) and \(b_2\) are the two bases, and \(h\) is the height)
Volume
Volume is the three-dimensional analog of area. It is often found by multiplying the base area of a figure by its height.
For example, the volume of a cylinder is found by multiplying the area of the circle of the cylinder by the height of the cylinder. Notice that this yields a unit of measurement that is cubed:
\[V=\pi r^2 \cdot h\]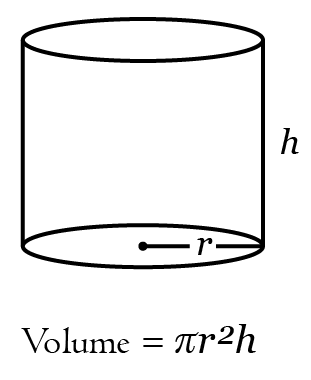
The volume of a cube is equal to the cube of the side length:
\[V=s^3\]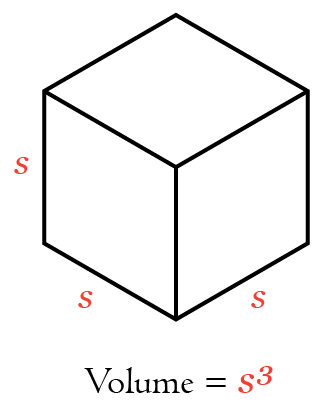
The volume of a sphere is:
\[V=\frac{4}{3}\pi r^3\]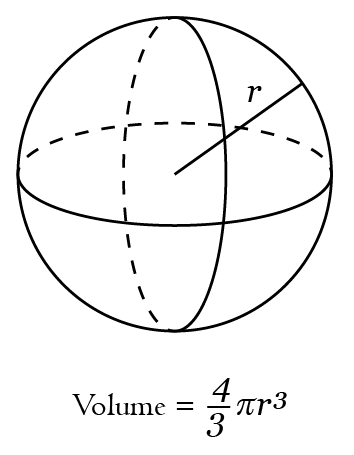
Statistical Data
A collection of data can be represented in various graphical forms. It is crucial to be able to read, analyze, and draw conclusions from these visual representations. Begin an analysis of any drawing or diagram by making sense of the title, axes, and labels provided.
It is helpful to familiarize yourself with some of the different types of graphs:
Scatterplots put the relationship between two sets of data in an \(x,y\) coordinate plane. Correlations can be deduced from scatterplots.
Histograms show the distribution of a set of data. They can be horizontal or vertical, and can also be expressed in terms of the frequency of data.
Pie charts utilize circles to represent the percentage breakdown of a whole.
It is advised that familiarity with each of these, as well as other graphical representations, is developed.
Mean, Median, and Mode
Consider the following set of data: \(1, \;2, \;3, \;3,\; 4, \;5\)
The mean, also known as the arithmetic average of a set of numerical data, is the ratio of the sum of the data values to the number of data values. So, in this case, the mean is equal to:
\[\frac{1\,+\,2\,+\,3\,+\,3\,+\,4\,+\,5}{6}\]The median is the middle value of a data set. It is found by sequentially ordering the data values and locating the value in the center. In the case of an even number of data, the median is the average of the middle values. In the data above, the median is 3.
The mode is the data value that occurs most frequently. In the case above, the mode is \(3\).
Basic Probability
The probability of an event taking place is the quantitative likelihood of the event occurring. It is calculated by dividing the number of ways a specified event can take place by the total number of events possible.
For example, consider a jar containing \(4\) blue marbles, \(5\) green marbles, and \(6\) red marbles. The probability of selecting a blue marble is found by dividing the number of blue marbles by the total number of marbles:
\[\frac{4}{15}=26.67%\]Probabilities always range from \(0\) to \(1\), where \(0\) indicates that the event will/can never happen. A probability of \(1\) indicates that the event will always happen.
Notice that when a probability is found, the probability of that event not happening is equal to \(1\) minus the calculated probability.
Number Systems
It is useful to become familiar with some of the different types of numbers: real numbers, integers, rational numbers, irrational numbers, and imaginary numbers.
A real number is any number that can be found on the number line, including any decimal value.
An integer is any positive or negative whole number, including 0.
A rational number is the ratio of any two integers, where the denominator cannot equal \(0\).
An irrational number is a number that cannot be written as the ratio of two integers. Pi is an example of an irrational number.
An imaginary number is a number that is the square root of a negative number.
Exponents and Roots
There is a simpler way to express repeated multiplication and division of the same number. This is where exponents and roots come into play.
Exponents
The multiplication of a value with itself can be best represented using an exponent. Consider the expression: \(2 \cdot 2 \cdot 2 \cdot 2\). This expression can be simplified with an exponent. Notice that \(2\) is being multiplied by itself \(4\) times. We simplify this as:
\[2^4=16\]This simplification extends to terms other than integers as well:
\[x \cdot x=x^2\]It is highly recommended that the rules of exponents are known and understood:
- Multiplication of exponents that share the same base is the same as adding the exponents:
- Division of exponents that share the same base is the same as subtracting the exponents:
[In the case where \(a\) = \(b\), this fraction evaluates to \(1 (x\ne0)\).]
- Raising an exponent to an exponent is the same as multiplying the exponents:
- A fractional exponent is the same as raising a base to the power of the numerator and evaluating the root of the denominator:
Roots
A root of a number is a quantity, that when multiplied by itself a certain number of times, results in the number. For example, the square root of \(4\) is \(2\), because \(2\) multiplied together \(2\) times is \(4\). The third root of \(8\) is also \(2\), because \(2\) multiplied by itself \(3\) times is \(8\). The \(n\)th root of a number is the number that when multiplied with itself \(n\) times yields the number.
Because roots are simply fractional exponents, the rules that apply to exponents also apply to roots.
A useful method for finding the \(n\)th root of a number is to prime-factorize the original value and determine if there is a number that is multiplied with itself \(n\) times. If so, this value is an \(n\)th root of the original number.
Basic Functions
A function takes an input value (commonly \(x\)) and returns an output value (commonly \(y\)). Because \(y\) depends on the input, or \(x\) value, it is called the dependent variable. Because \(x\) does not depend on \(y\) (we choose the \(x\) value to test), it is called the independent variable.
Function notation is written as: \(f(x)=x\), or some variation of this, where \(x\) is the input value, and \(f(x)\) is the output value. Functions can be graphed by creating an \((x,f(x))\) table, and plotting the points.
A function must only yield one (\(f(x)\)) value for each \(x\) input. An equation that yields \(2 f(x)\) values for an \(x\) input is said to fail the vertical line test because the vertical line intersects the graph in two locations. In order to be a function, the equation must pass the vertical line test.
Functions can be combined through addition or subtraction or can be multiplied and divided by other functions. Function composition is used to verify that two functions are inverses of each other. Function composition entails substituting the variable of one of the functions with the other function.
All Study Guides for the PSAT/NMSQT Exam are now available as downloadable PDFs